Hope everyone is enjoying the Fall? Thought it would be interesting to compare some details about single family real estate for each city on Anna Maria Island.
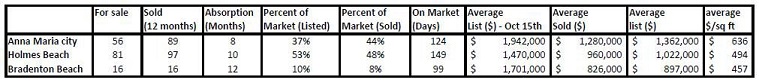
DEFINITIONS: “For Sale” column provides a snap shot of single family properties for sale In the corresponding city as of the middle of October. “Sold” column are number of single family properties sold in the last 12 months for each City. “Absorption” is a measure of how many months of inventory are on hand based on the sold pace for the last 12 months. “Percent of Market (Listed)” provides the percentage of total properties on Anna Maria Island listed and same with percent sold. So for example Bradenton Beach has 10% of the properties listed on all of Anna Maria Island currently and in the last 12 months Bradenton Beach represents 8% of the total number of single family homes sold on Anna Maria Island. “On Market” displays numbers of cumulative days on the market. “Average List – OCT 15th” is the average list price of the properties currently for sale in the middle of October. “Average Sold” provides the average sold price by city. “Average List” shows the average list price of the sold properties for the last 12 months and “average $/Sq ft is the average per square foot for all properties in the City sold in the last 12 months.
A few conclusions can be drawn from the above information. Firstly, Anna Maria City is a hotter market given the percent sold is significantly higher than the current percentage of inventory of properties for sale in Anna Maria City. This can also be drawn from 8 months of inventory on hand for Anna Maria City versus Holmes Beach at 10 months and Bradenton Beach of 12 months. Another important detail is while inventory absorption is 8-10 months, the time properties that have SOLD is much less, more like half that time, 4-5 months. This points us in the direction that properties that are priced right will sell much quicker.
Let’s dig more into the data of pricing property correctly. Using the same 202 single family properties that sold on Anna Maria Island in the last 12 months, I segregated the sold properties into sold within 6 months and sold after 6 months had elapsed. The data is very enlightening. There were 64 properties that sold beyond 6 months or almost 1/3 of all single family properties sold beyond 6 months. Average sale price was $1.119M, $501 per square foot and get this, the AVERAGE time the property sold, 292 days! 139 properties sold within 6 months or 2/3 of the inventory sold within 6 months, sold price is $1.076 M, $577 per sq ft and the AVERAGE time the property sold was 61 days!! That is two months. WOW! Almost an 8 month difference!
Of the current inventory for sale, about half has been on the market more than 6 months and half has been less.
Moral to the story, price your property right and on average it will sell in less than 2-3 months. Price it too high and the property may sell after 10 months. One caveat to make matters worse, currently half the single family properties for sale have been on the market 342 days. What does that mean? A seller that prices their property too high has a 50-50 shot at selling in 10 months, otherwise appears it could go much longer!

Learn More about Carol Bernard, Sales Support Expert at Island Real Estate in our Marina Drive office. Carol has been with the company since 1994 and has worked in early every department across our company – from rentals & reservations to sales support & more!
During her off hours, you’ll find her nose buried in a stack of reading, likely with one of her three cats curled up on her lap. She’s an avid local sports fan, often donning Buccaneer, Tampa Bay Rays, or Lightning gear when out of the office.